On this page
How to export telemetry data to HyperDX
HyperDX is an open source observability platform that unifies logs, traces, metrics, exceptions, and session replays into a single interface. It helps developers debug applications faster by providing a complete view of your system's behavior and performance.
OpenTelemetry (often abbreviated as OTel) provides a standardized way to collect and export telemetry data. Deno includes built-in OpenTelemetry support, allowing you to instrument your applications without additional dependencies. This integration works seamlessly with platforms like HyperDX to collect and visualize telemetry data.
In this tutorial, we'll build a simple application and export its telemetry data to HyperDX:
- Setting up your application
- Configuring the OpenTelemetry collector
- Viewing telemetry data
- Next steps
You can find the complete source code for this tutorial on GitHub.
Set up the app Jump to heading
For this tutorial, we'll use a simple chat application to demonstrate how to export telemetry data. You can find the code for the app on GitHub.
Either take a copy of that repository or create a main.ts file and a .env file.
In order to run the app you will need an OpenAI API key. You can get one by
signing up for an account at OpenAI and
creating a new secret key. You can find your API key in the
API keys section of your OpenAI
account. Once you have an API key, set up an OPENAI_API-KEY environment
variable in your .env file:
OPENAI_API_KEY=your_openai_api_key
Set up the collector Jump to heading
First, create a free HyperDX account to get your API key. Then, we'll set up two files to configure the OpenTelemetry collector:
- Create a
Dockerfile:
FROM otel/opentelemetry-collector:latest

COPY otel-collector.yml /otel-config.yml

CMD ["--config", "/otel-config.yml"]
This Dockerfile:
- Uses the official OpenTelemetry Collector as the base image
- Copies your configuration into the container
- Sets up the collector to use your config when it starts
- Create a file called
otel-collector.yml:
receivers:
  otlp:
    protocols:
      grpc:
        endpoint: 0.0.0.0:4317
      http:
        endpoint: 0.0.0.0:4318

exporters:
  otlphttp/hdx:
    endpoint: "https://in-otel.hyperdx.io"
    headers:
      authorization: $_HYPERDX_API_KEY
    compression: gzip

processors:
  batch:

service:
  pipelines:
    traces:
      receivers: [otlp]
      processors: [batch]
      exporters: [otlphttp/hdx]
    metrics:
      receivers: [otlp]
      processors: [batch]
      exporters: [otlphttp/hdx]
    logs:
      receivers: [otlp]
      processors: [batch]
      exporters: [otlphttp/hdx]
This configuration file sets up the OpenTelemetry collector to receive telemetry data from your application and export it to HyperDX. It includes:
- The receivers section accepts data via gRPC (4317) and HTTP (4318)
- The Exporters section sends data to HyperDX with compression and authentication
- The processors section batches telemetry data for efficient transmission
- The pipelines section defines separate flows for logs, traces, and metrics
Build and run the docker instance to start collecting your telemetry data with the following command:
docker build -t otel-collector . && docker run -p 4317:4317 -p 4318:4318 otel-collector
Generating telemetry data Jump to heading
Now that we have the app and the docker container set up, we can start generating telemetry data. Run your application with these environment variables to send data to the collector:
OTEL_EXPORTER_OTLP_ENDPOINT=http://localhost:4318 \
OTEL_SERVICE_NAME=chat-app \
OTEL_DENO=true \
deno run --unstable-otel --allow-net --allow-env --env-file --allow-read main.ts
This command:
- Points the OpenTelemetry exporter to your local collector (
localhost:4318) - Names your service "chat-app" in HyperDX
- Enables Deno's OpenTelemetry integration
- Runs your application with the necessary permissions
To generate some telemetry data, make a few requests to your running application
in your browser at http://localhost:8000.
Each request will:
- Generate traces as it flows through your application
- Send logs from your application's console output
- Create metrics about the request performance
- Forward all this data through the collector to HyperDX
Viewing telemetry data Jump to heading
In your HyperDX dashboard, you'll see different views of your telemetry data:
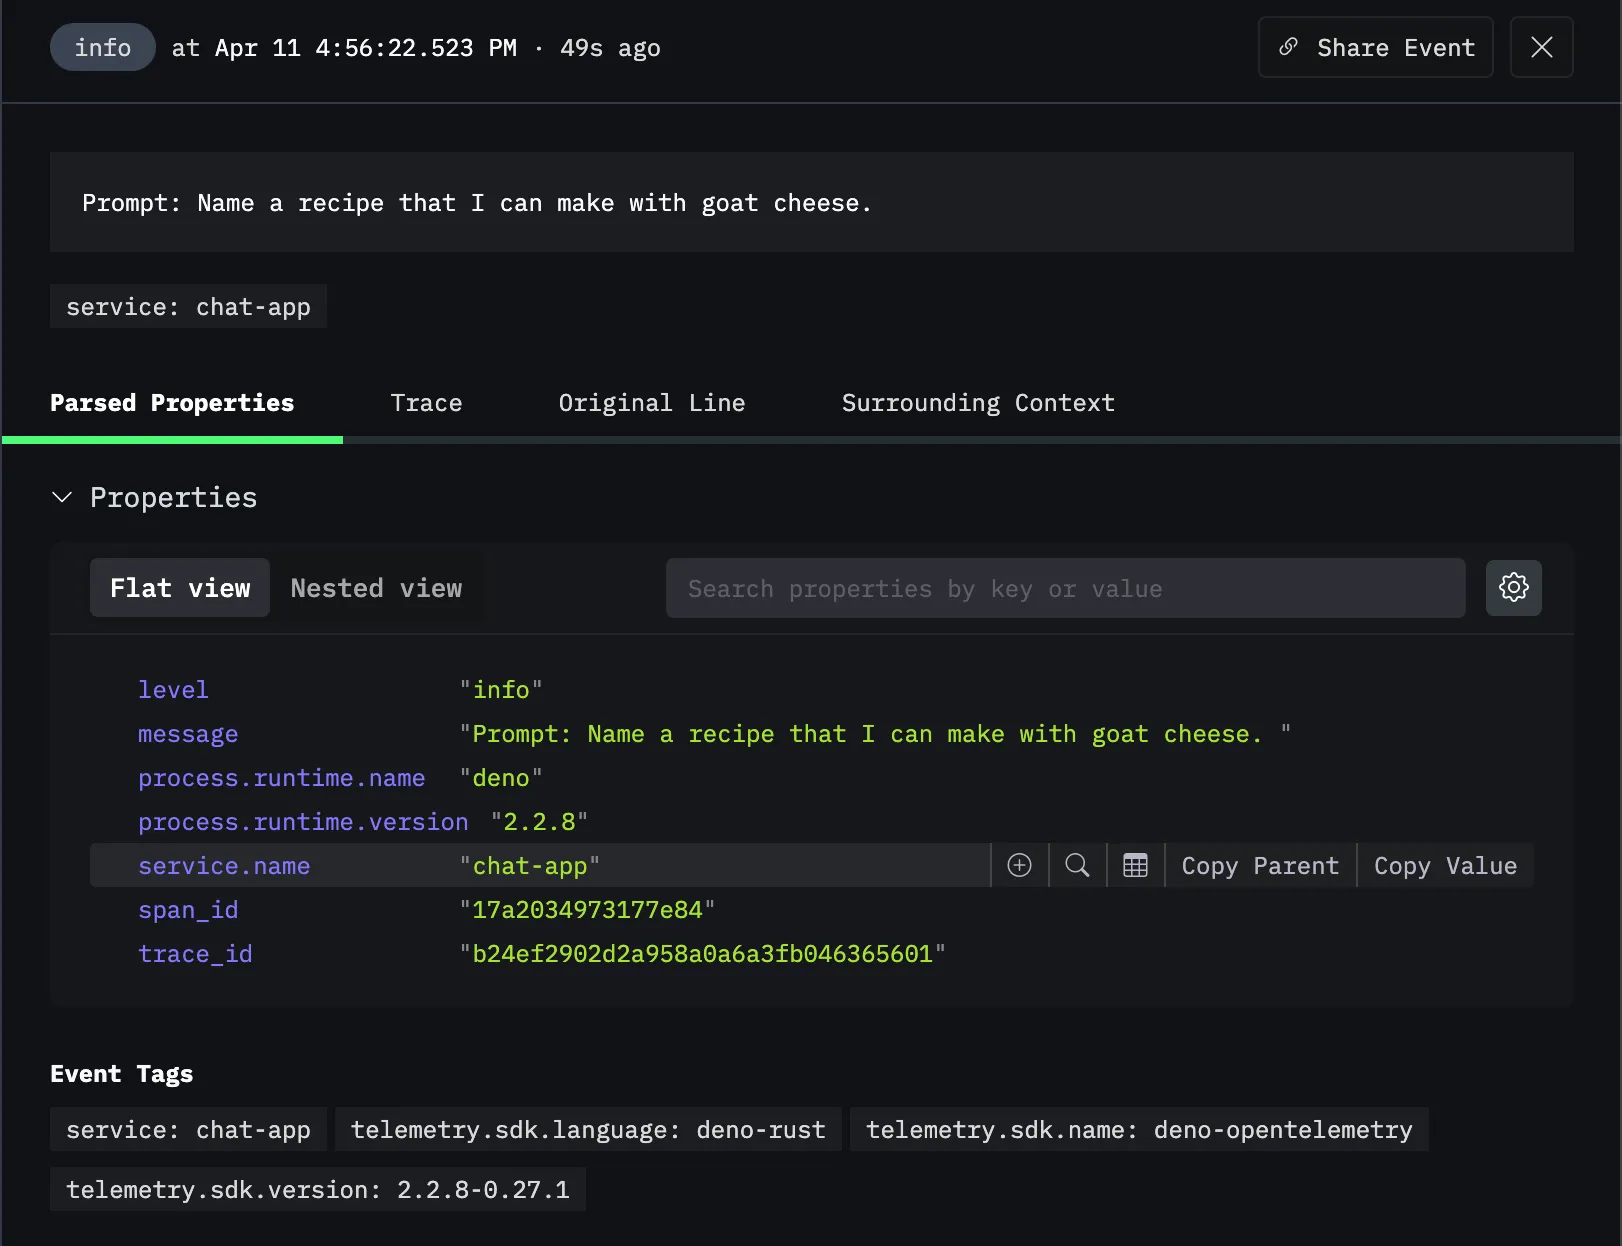
Logs View Jump to heading
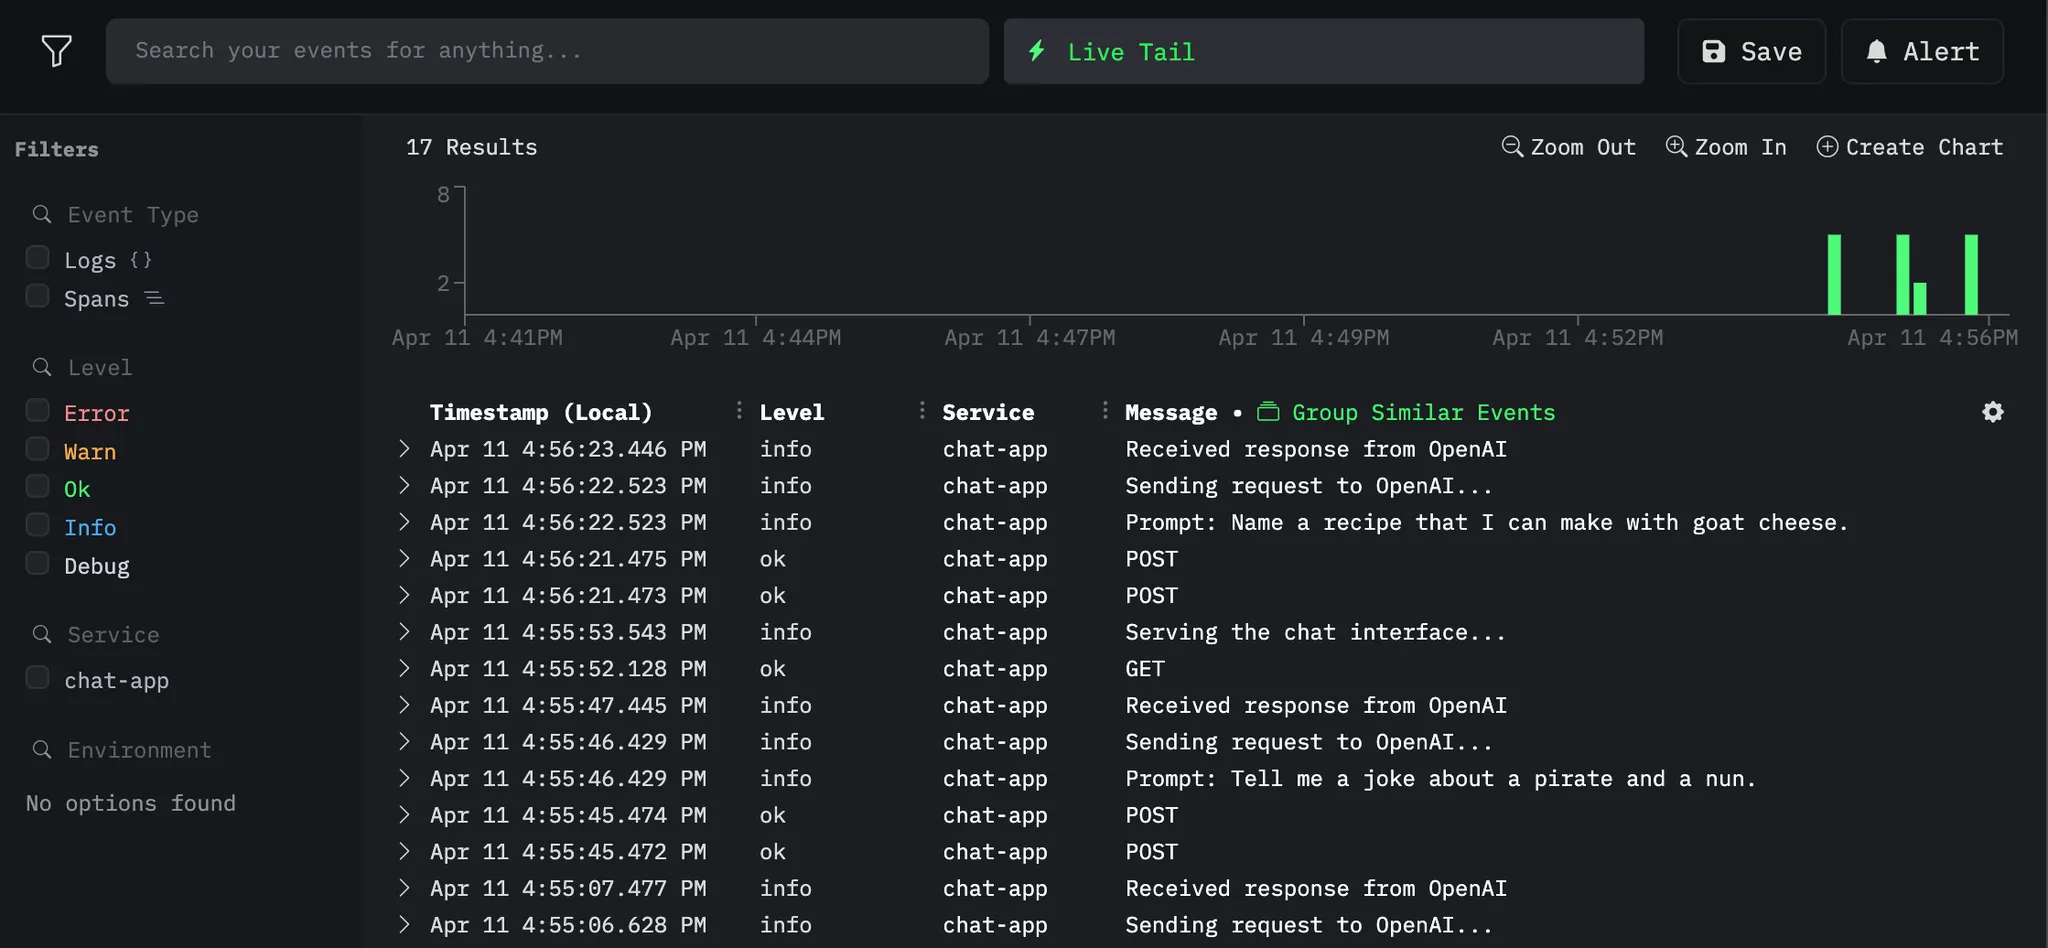
Click any log to see details:
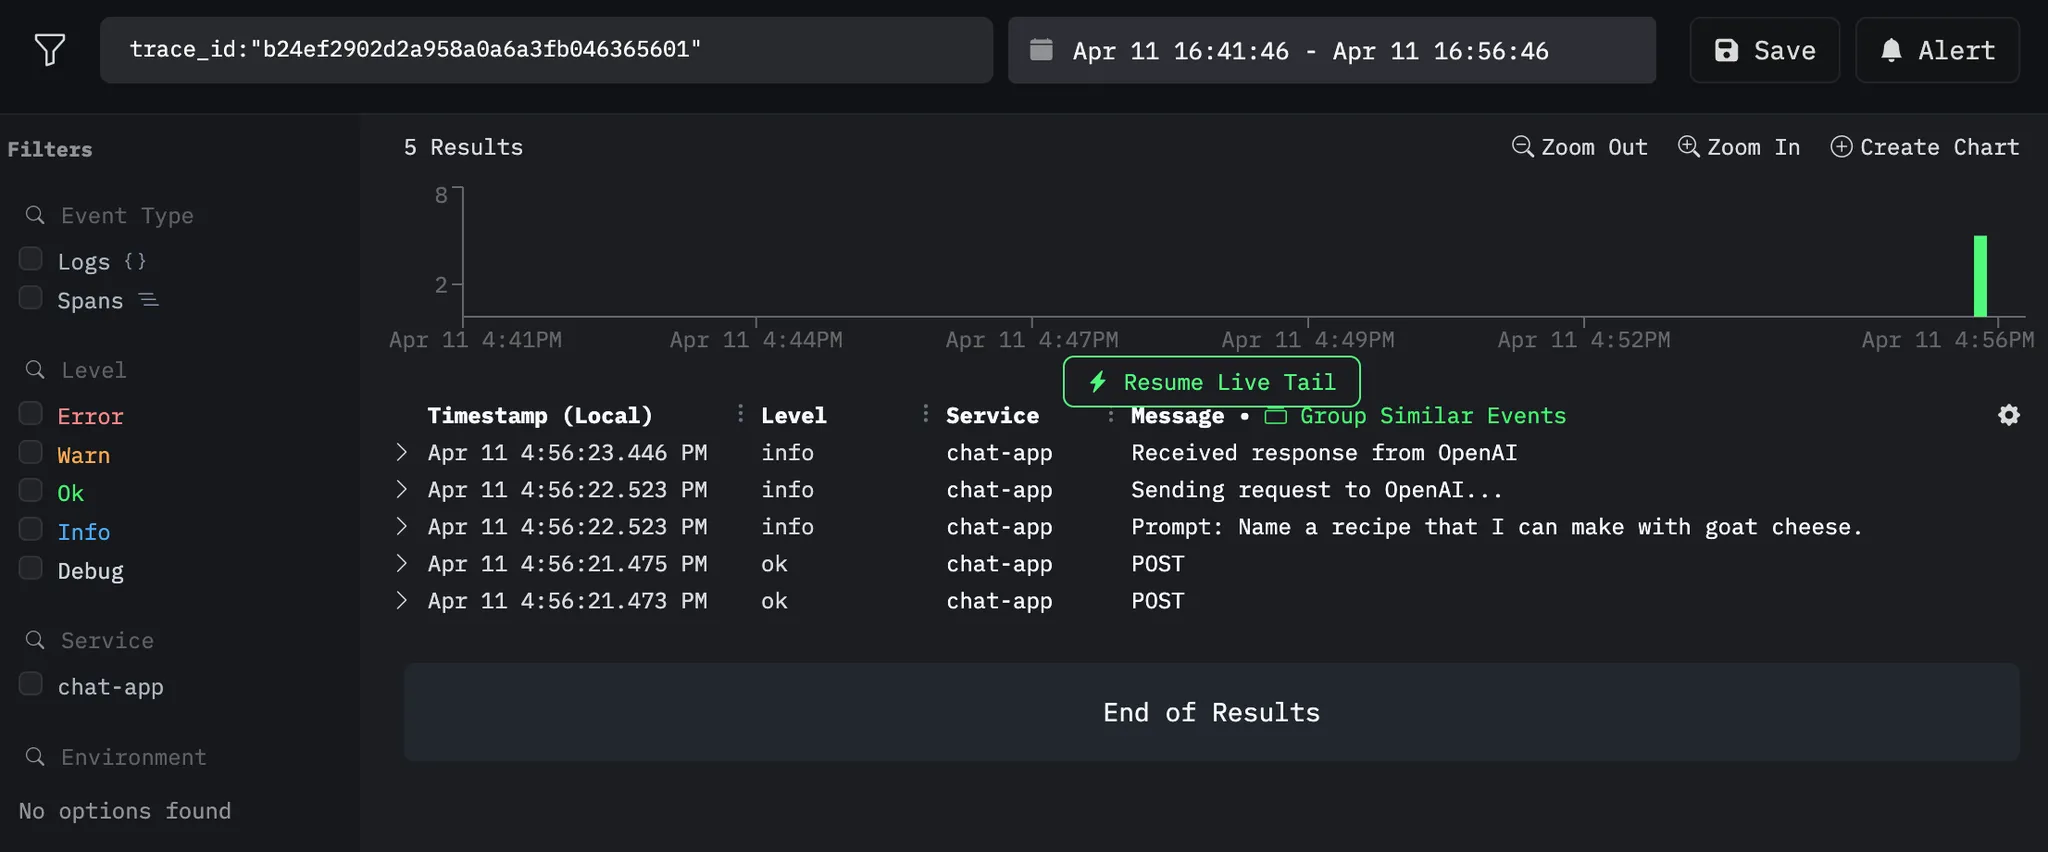
Request Traces Jump to heading
See all logs within a single request:
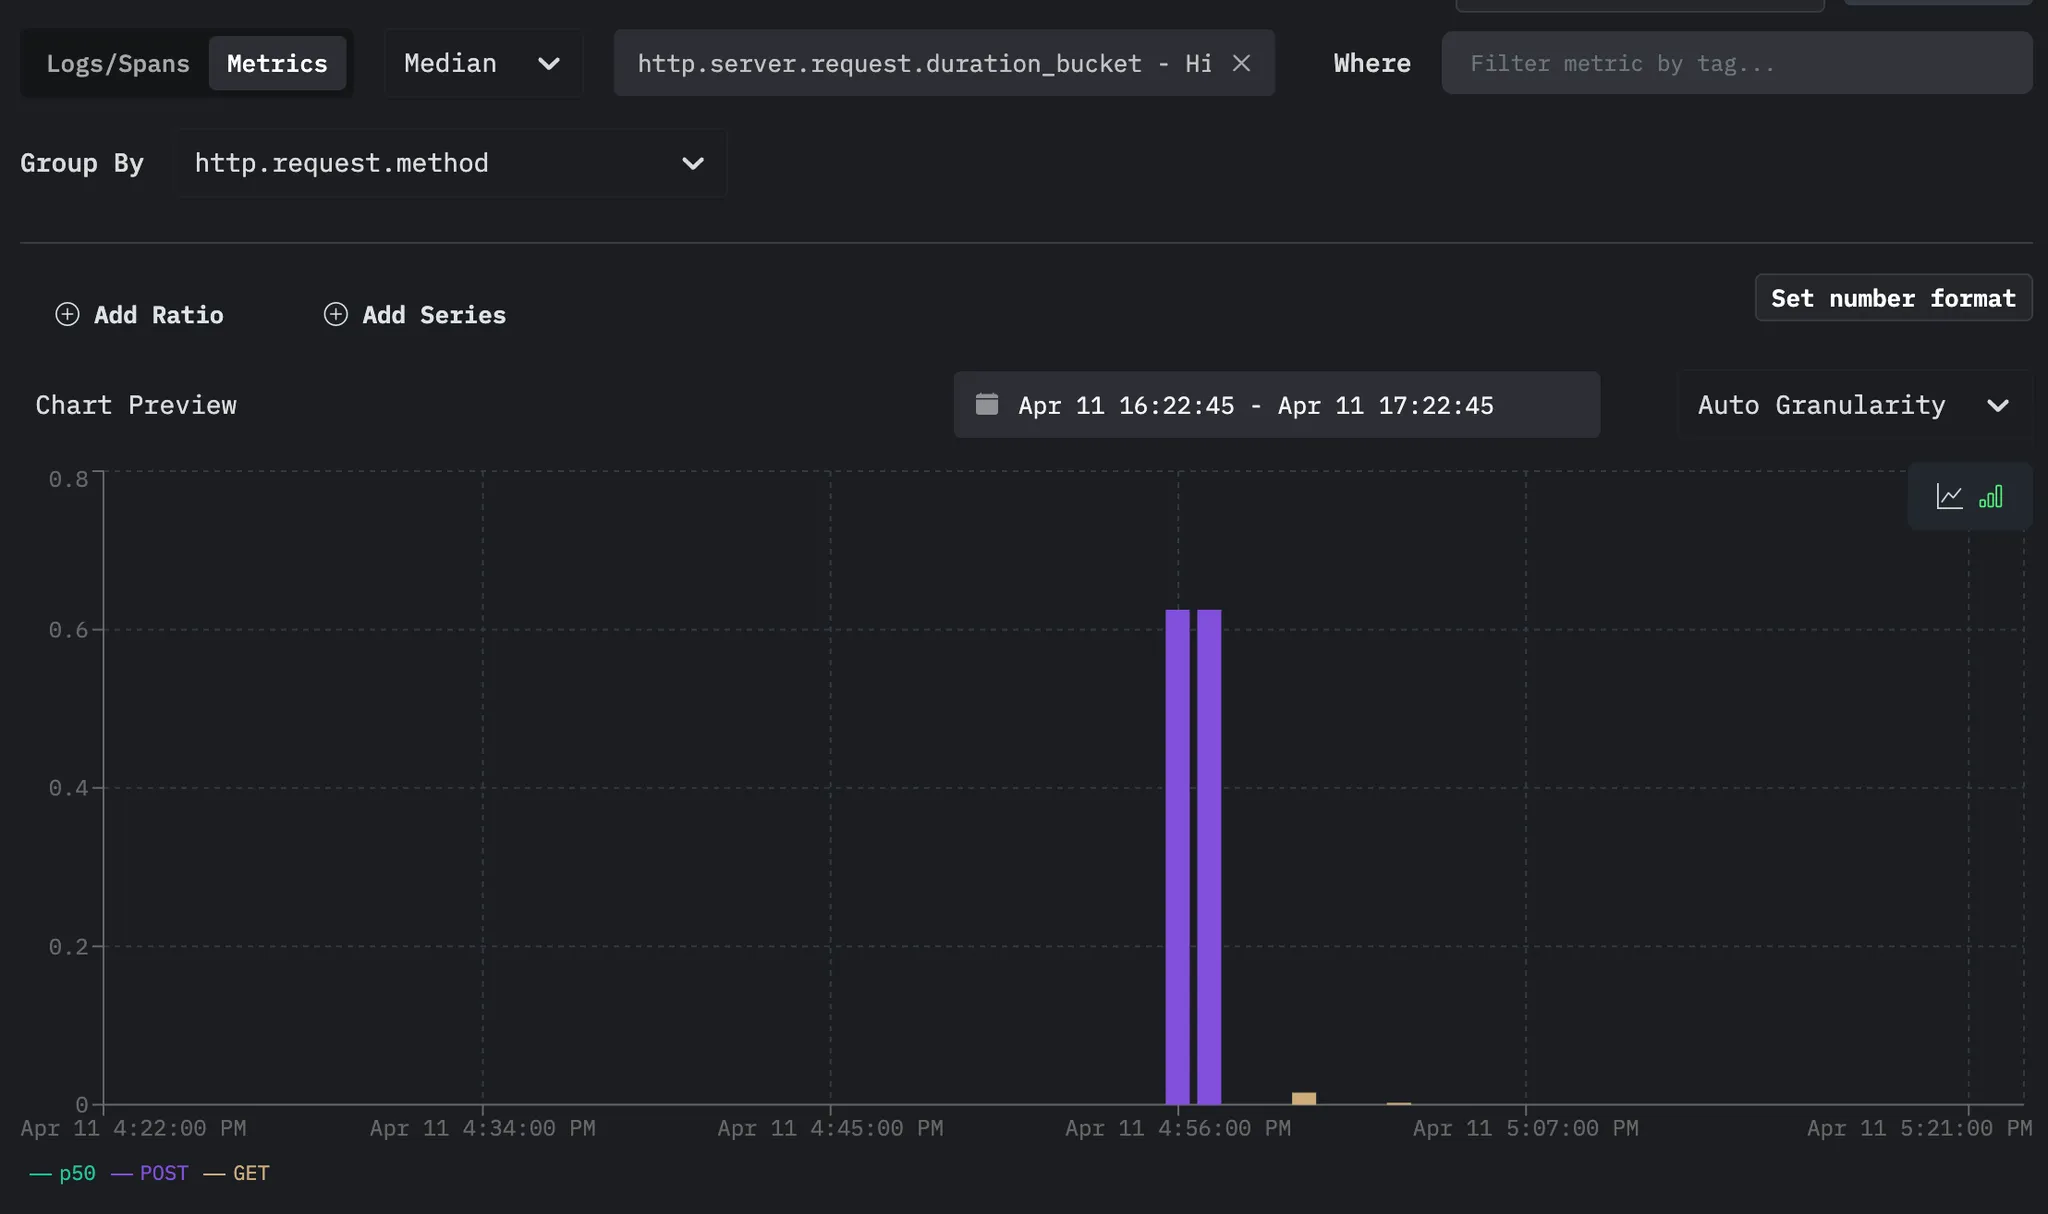
Metrics Dashboard Jump to heading
Monitor system performance:
🦕 Now that you have telemetry export working, you could:
- Add custom spans and attributes to better understand your application
- Set up alerts based on latency or error conditions
- Deploy your application and collector to production using platforms like:
🦕 For more details on OpenTelemetry configuration with HyperDX, see their documentation.